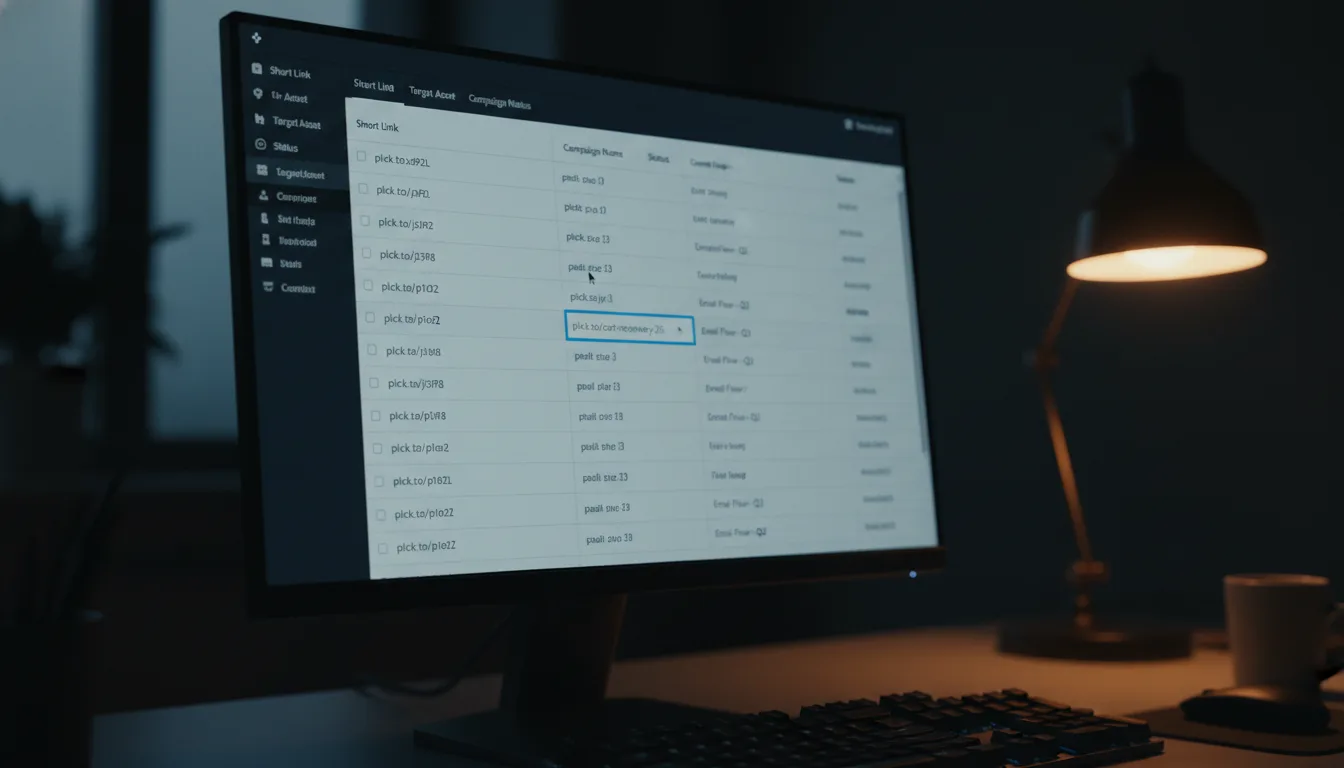
Advanced Planck Spaces: Track Engagement by Project

Ready to get started?
Join thousands of users who are already using our platform to manage their links efficiently.
Create Your Free AccountAdvanced Link Management: Elevating Data Analytics Through Strategic Organization – Finally Getting Your Clicks in Order!
Here's a little secret for you, straight from the world of digital analytics: marketing teams that truly nail their data organization can see a whopping 43% reduction in multi-touch attribution errors and a 35% boost in campaign optimization speed. Pretty impressive, right? But let's be real, as your digital footprint expands from just a handful of URLs to thousands of concurrent marketing assets, that flat, unorganized list of links you're probably working with? Yeah, that quickly becomes a massive headache and an analytical black hole.
You might be wondering, how do you get those truly actionable, statistically significant insights from all that click data? For intermediate and advanced marketers, it’s about moving beyond basic link tracking. It's time to embrace a more sophisticated, hierarchical approach to data management. And this, my friends, is where Space Creation becomes an absolute game-changer. Imagine organizing all your shortened links into custom, project-specific "spaces." Suddenly, those fragmented click metrics aren't just random numbers anymore; they transform into cohesive, aggregated behavioral data. It’s like turning a messy pile of LEGOs into a perfectly constructed masterpiece!
In this comprehensive guide, we're going to dive deep into the advanced strategies for tracking engagement by project. We’ll explore exactly how to structure your link environments, how to aggregate campaign-level data like a pro, and even how to troubleshoot those tricky structural anomalies that can mess up your reporting. Our goal? To ensure your data remains pristine, trustworthy, and incredibly actionable.
"Data is only as valuable as the architecture that houses it. Without hierarchical organization, individual click metrics are merely isolated data points devoid of broader strategic context – and that's just a missed opportunity!"
The Essential Prerequisites for Kicking Off Advanced Link Tracking
Alright, before we jump headfirst into structuring your links into neat, project-based clusters, let’s pump the brakes for a second. You absolutely need to establish a solid foundational data strategy first. Think of it like building a house: you wouldn't start framing the walls without pouring a proper foundation, right? Trying to dive straight into spatial organization without a clear, thought-out taxonomic framework often leads to fragmented analytics, confusing reports, and even compromised historical data. Nobody wants that!
Establishing Your Baseline Metrics: What Does "Success" Even Look Like?
When you're dealing with advanced project tracking, you need a crystal-clear understanding of what metrics genuinely dictate success for *your* specific goals. While total click volume is a fundamental, gotta-have-it indicator, truly evaluating a project's overall health requires aggregating secondary metrics across multiple links. It’s not just about how many clicks you get; it’s about what kind of clicks, where they come from, and what they lead to. So, before you start, make sure you establish baselines for:
- Aggregate Click-Through Rate (CTR): This is your average engagement rate across *all* the links within a specific project boundary. It gives you a birds-eye view of how captivating your project is as a whole.
- Geographic Distribution: Are your clicks coming from where you expect them? This helps you spot regional variances in engagement patterns across your consolidated campaign.
- Device and Referrer Dominance: Understanding the primary traffic sources (think mobile vs. desktop, or social media vs. email) driving the majority of your project-level engagement is crucial for optimizing future campaigns.
Establishing these pre-campaign baselines is super powerful! It allows you to measure the standard deviation of new project spaces against historical performance. This means you can quickly identify which initiatives are absolutely crushing it and which ones might be underperforming, giving you a serious analytical edge.
Defining Your Project Taxonomies: Your Data's North Star
Here’s the thing: a rigid, well-thought-out nomenclature isn’t just a nice-to-have; it's the absolute backbone of your data integrity. Before you even think about grouping links, you need to define a standardized naming convention – not just for the individual links, but for the spaces themselves! A smart, data-driven taxonomy usually includes elements like the year, quarter, specific channel, and a clear campaign identifier. For example, something like 2024_Q3_Social_ProductLaunch instantly tells you a lot.
Why bother with all this precision? Because this systemic approach ensures that when you pull aggregate reports from your spaces, the underlying data strings are easily parsed and understood. This makes it a breeze to integrate with external Business Intelligence (BI) tools or even good old pivot tables. Trust us, your future self (and your analytics team!) will thank you for this upfront effort.
Step-by-Step Instructions: Setting Up Your Project Spaces for Peak Performance
Ready to level up your link management? Transitioning to a structured, space-based architecture isn't something you just "wing"; it requires deliberate, thoughtful execution. These steps will walk you through exactly how to build robust, project-specific environments using a powerful tool like Planck.to. The goal? To ensure your engagement metrics are perfectly isolated, segmented, and free from external noise.
Step 1: Architecting Your Space Structure – The Big Picture
First things first, let's get organized! Start by mapping out your organizational chart or your marketing calendar to your digital workspaces. Within Planck.to, you'll kick this off by creating discrete spaces that act as powerful macro-containers for your specific initiatives. Instead of throwing all your Q4 marketing efforts into one giant, messy default dashboard, why not create separate spaces? Think "Q4 Black Friday," "Q4 Webinar Series," or "Q4 Influencer Outreach." See how much clearer that is already?
This creates a kind of "hard boundary" that's absolutely crucial. It prevents high-volume, potentially low-intent traffic (like those broad social media blasts) from accidentally skewing the engagement data of low-volume, high-intent traffic (such as your targeted enterprise email outreach campaigns). This isolation is key to getting truly clean data.
Don't go overboard here! Try to limit the number of top-level spaces to your primary quarterly or major annual objectives. Excessive segmentation, while it sounds good in theory, can actually lead to macro-data fragmentation, making it surprisingly difficult to achieve statistical significance in your aggregate reporting. Find that sweet spot!
Step 2: Implementing Sub-Categorization and Link Generation – Getting Specific
Once your macro-environments are up and running, it's time to start populating them! Begin adding custom, channel-specific links. The golden rule here is simple: every link generated for a particular project *must* strictly reside within its designated space. No exceptions!
Let's take an example: if you're tracking a brand-new product launch, you'd generate distinct URLs for each different distribution channel, and all of them would live within that specific "Product Launch" space. Here's what that might look like:
- Email placement: planck.to/launch-email-oct
- LinkedIn organic post: planck.to/launch-in-organic
- Paid search ad: planck.to/launch-sem-b2b
By keeping all these specifically encoded planck.to links neatly confined within your "Product Launch" space, you're essentially creating a hermetically sealed data environment. This means no cross-contamination, just pure, unadulterated project data.
Step 3: Aggregating Project-Specific Data – The Payoff
Now for the exciting part! The ultimate goal of this entire setup is holistic, big-picture analysis. Head over to the analytics dashboard of your newly populated space. This is where you'll observe the aggregate performance of the *entire project*. Take a moment to evaluate the composite data – things like total unique visitors and blended conversion rates – before you even think about drilling down into the performance of individual planck.to links.
Why this top-down approach? Because it allows you to compare the aggregate baseline of the space against external variables, such as your total project spend. This is how you calculate a highly accurate Return on Investment (ROI) or Cost Per Acquisition (CPA) for the *entire initiative*. Talk about data-driven decision-making!
You've done it! You've successfully implemented a hierarchical tracking structure. Your project spaces now provide an isolated, noise-free environment, empowering you to analyze macro-trends and campaign efficacy with absolute pinpoint accuracy. Give yourself a pat on the back!
Practical Examples: Seeing Data-Driven Space Architectures in Action
Theory is great, but to truly grasp the immense power of space creation, we need to look at how data-centric organizations are actually deploying these strategies in the real world. Analyzing concrete examples really illuminates the vast difference between basic, haphazard tracking and enterprise-grade link management. Let's dive into a couple of scenarios.
The B2B Content Marketing Funnel: Unlocking Report Insights
Imagine a B2B SaaS company that’s just released its annual industry report – a huge content marketing effort! The marketing team is deploying a multi-touch attribution strategy across a gazillion platforms. Now, without these dedicated spaces, tracking the overall engagement of that "Annual Report" project would be a manual, error-prone nightmare, right? We're talking endless exporting data to spreadsheets and wrestling with VLOOKUPs. No thanks!
Instead, the savvy analytics team creates a dedicated "2024 Industry Report" space. Inside this space, they generate super-specific tracking links for every touchpoint: planck.to/report-24-partner-newsletter, planck.to/report-24-display-ads, and planck.to/report-24-sales-enablement. You get the idea.
Because these links are all neatly clustered, the Director of Marketing can instantly open that space's dashboard and see at a glance that the project has generated, say, 45,000 aggregate clicks, with a 62% engagement rate originating from desktop devices in North America. What does this aggregated data tell them? That enterprise prospects (who typically use desktop devices) are their primary consumers, which perfectly validates the campaign's B2B targeting strategy. Powerful stuff, isn't it?
Multi-Channel E-commerce Campaigns: Responding to Real-Time Velocity
E-commerce brands, especially those dealing with high-velocity promotional cycles like a Black Friday Cyber Monday (BFCM) weekend, face absolutely massive data influxes. A 72-hour flash sale might require anywhere from 50 to 100 distinct shortened links spread across SMS, email, affiliates, and paid social channels. Keeping tabs on all that without structure? Nearly impossible.
But by utilizing a dedicated "BFCM Flash Sale" space, the brand's data scientists can monitor the real-time velocity of the *entire campaign*. Here's where it gets interesting: if the aggregated click trajectory suddenly falls below their projected benchmark of 150 clicks per minute during peak hours, the team can instantly pivot! They can reallocate ad spend on the fly or push out a secondary SMS blast (e.g., planck.to/bfcm-sms-boost) to immediately stimulate engagement. This kind of real-time responsiveness is simply invaluable during critical sales periods.
Common Mistakes in Project-Based Link Management (And How to Avoid Them!)
Even seasoned intermediate analysts can sometimes stumble into common architectural traps when they're configuring project spaces. Understanding these statistical and structural pitfalls isn't just helpful; it's absolutely essential for maintaining a high-fidelity, trustworthy data environment. Let's talk about a couple of big ones.
Over-Granular Space Creation (The Dreaded Data Dilution)
One of the most frequent errors we see in hierarchical link management is simply too much segmentation. It sounds counterintuitive, right? More organization is better, isn't it? Well, not always. Creating a separate space for every minor social media post or every tiny micro-campaign can actually severely dilute your precious data pool. Think about it: if a space contains only a handful of links generating fewer than, say, 100 clicks combined, those aggregate metrics simply lack statistical significance. A single accidental click or a sneaky bot interaction can easily skew that space's overall conversion rate by double digits!
The lesson here? Ensure that your spaces truly represent macro-projects – initiatives with enough anticipated traffic to yield reliable, significant data trends. It's about quality data, not just quantity of spaces.
Statistical reliability thrives on volume. If individual micro-projects aren't likely to generate a minimum threshold of engagement data needed for confident decision-making, it's often better to group them into broader, more categorical spaces.
Neglecting Naming Conventions Post-Grouping: Don't Lose Context!
Here’s another common misstep: marketers sometimes mistakenly assume that because links are already grouped within a specific project space, the individual URL slugs no longer require strict naming conventions. This, my friends, is a critical data governance failure! It's like putting all your books into the right shelf but then removing all their titles. What happens if you need to pull that data out for a deeper CRM analysis? Vaguely named links like planck.to/promo1 and planck.to/promo2 completely lose their context outside the platform ecosystem.
So, the rule of thumb? Always maintain rigorous, descriptive naming taxonomies for your individual links, regardless of their spatial organization. It's a small effort that pays huge dividends in data clarity down the line.
Troubleshooting Data Irregularities in Your Spaces: A Quick Fix Playbook
Let's face it: when you're managing large sets of performance data, you're bound to encounter an anomaly or an irregular reporting pattern within your project spaces from time to time. It happens to the best of us! But don't panic. Here’s a handy technical playbook for quickly diagnosing and resolving some of the most common issues you might run into.
Fixing Mismatched Attribution and Skewed Averages
Problem Statement: You've noticed a specific project space is reporting an aggregate click-through rate or geographical distribution that just drastically contradicts what your external analytics tools (like Google Analytics) are telling you. What gives?
Likely Causes: More often than not, this happens when a high-volume, generic link (like that permanent homepage link you keep in your Instagram bio) is accidentally assigned to a highly targeted project space. The sheer, massive influx of broad traffic from that general link mathematically drowns out the nuanced, specific data of your targeted project links. It's like putting a rock concert in a library – the library's natural quietness is completely overwhelmed!
Step-by-Step Fixes:
- First, conduct a thorough audit of the link inventory within the affected space.
- Next, sort the links by total click volume in descending order. This should help you quickly pinpoint those outlier links that are causing all the trouble.
- Once you've found it, migrate that misclassified high-volume link back to your "Default" or "Evergreen" space where it belongs.
- Finally, recalculate the aggregate metrics for the space. You should see the space's baseline return to its expected, accurate parameters.
Auditing Historical Link Data: When Things Look Fragmented
Problem Statement: You're transitioning a legacy project into a newly created space, and suddenly, the historical engagement data appears fragmented or incomplete. Where did all those old clicks go?
Verification Steps: Don't panic! Data doesn't just disappear when a link is moved between spaces. The most common culprit here is your reporting dashboard's timeline parameters. If your new space's default reporting view is set to "Last 30 Days," for example, those legacy clicks from months or years ago simply won't instantly populate the visual graphs.
The fix? Simply adjust your date range constraints to encapsulate the entire lifecycle of those imported URLs. Once you do, all that historical data should reappear, ready for analysis.
Make it a habit to perform link audits quarterly. Proactively reassigning orphaned or misclassified links to their proper project spaces retrospectively ensures that your year-end aggregate data reports are structurally sound, accurate, and ready to impress.
Conclusion: It's Time to Institutionalize Data-Driven Link Management
As digital campaigns grow increasingly intricate and complex, relying on a basic, unstructured list of URLs is more than just inconvenient; it’s a critical vulnerability in your entire analytics infrastructure. Seriously, it's like trying to navigate a dense jungle without a map! But here's the good news: by strategically leveraging Space Creation within a platform like Planck.to, you fundamentally upgrade your data maturity model. You don't just track clicks; you understand them in a whole new dimension.
Organizing your links by project, campaign, or even departmental category ensures that your engagement metrics aren't just accurate – they become profoundly contextualized. Imagine the power! The ability to isolate performance data into dedicated spaces empowers marketing teams to run incredibly precise A/B tests, measure true multi-channel ROI with confidence, and extract genuinely actionable insights. No more guesswork, just data-backed brilliance.
So, what are you waiting for? Commit to standardizing your link architecture today. Establish those rigid naming conventions we talked about, segment your tracking assets logically, and let structured data be the unwavering guide for all your strategic decision-making. Your campaigns (and your sanity!) will thank you.
Ready to get started?
Join thousands of users who are already using our platform to manage their links efficiently.
Create Your Free Account