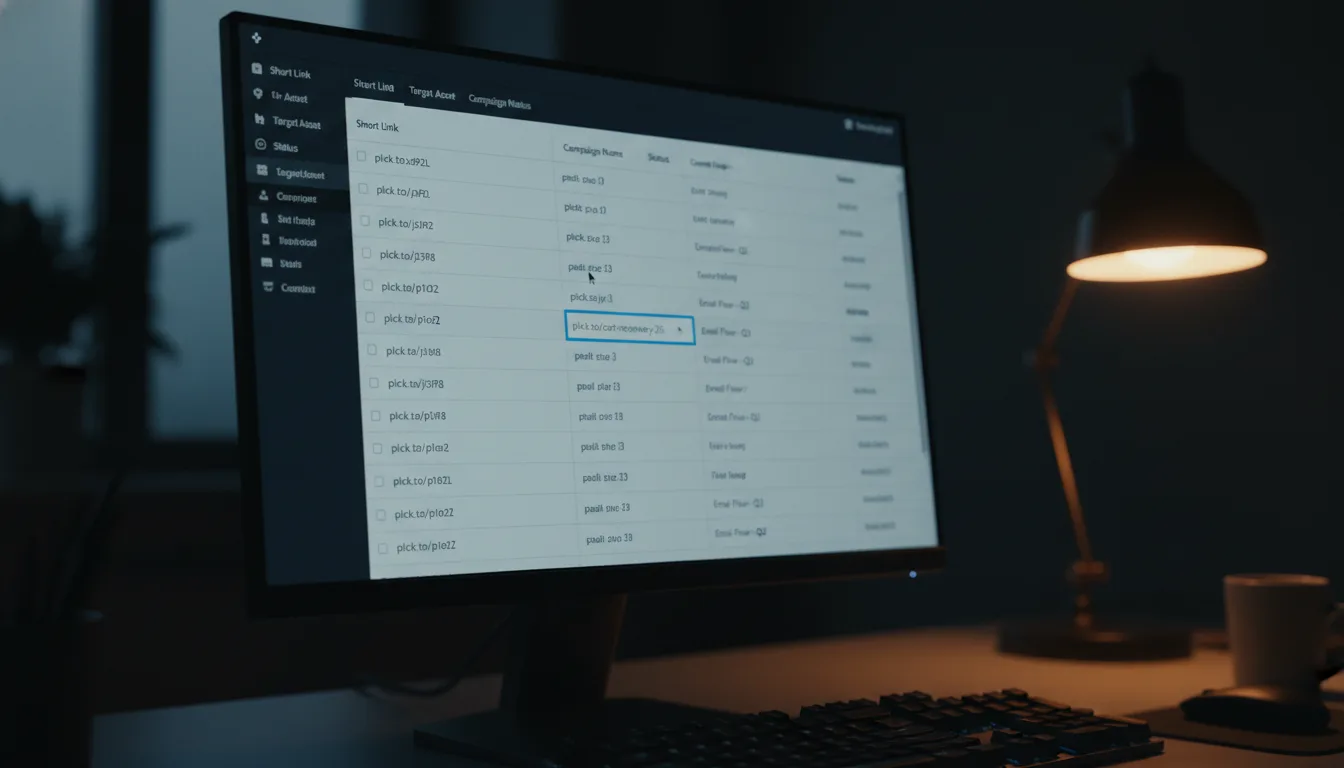
Link Performance Reporting: Analyze Your URL Data

Ready to get started?
Join thousands of users who are already using our platform to manage their links efficiently.
Create Your Free AccountUnlocking Your URL's Secrets: A Deep Dive into Link Performance Reporting
Let's be honest: in today's fast-paced digital world, a URL isn't just a simple address anymore. It's transformed into something far more powerful. Think of it as a tiny, sophisticated sensor, constantly gathering data. Every time someone clicks, it’s capturing vital information about user behavior, how well your campaigns are doing, and even who your audience is. For anyone serious about digital marketing or data analysis, being able to truly understand this data isn't just helpful—it's the secret sauce that separates campaigns that soar from those that just… flop.
But here’s the thing: simply having data is one thing; turning it into actionable intelligence is another beast entirely. You've probably heard of the "data rich, information poor" syndrome, right? It’s when you're tracking a ton of clicks, but you're still scratching your head, wondering what story those numbers are trying to tell you. Effective link reporting demands a shift. We need to move beyond just counting clicks (hello, vanity metrics!) and start focusing on true performance indicators—the kind that actually drive smart, impactful decisions.
So, what are we going to do today? We're going on an exciting journey deep into the architecture of link performance reporting. We'll pull apart the key metrics that truly define success, benchmark them against industry standards, and lay out a robust framework for tracking and reporting on all your precious URL data. Get ready to transform your links into powerful business intelligence tools!
Link analytics aren't just about tallying traffic. They're about attributing value. A truly comprehensive report doesn't just ask "how many?" It answers the crucial "who, when, where, and why" behind every single interaction with your links.
1. Decoding the Click: Essential Metrics You Need to Know
Before we can even think about setting benchmarks or comparing our performance, we've got to speak the same language. It's incredibly important to standardize our metric definitions. Why? Because fuzzy data definitions are notorious for creating flawed reports and causing major headaches (and misaligned expectations!) between marketing teams and the big-picture stakeholders. Let's get crystal clear on what each click truly means.
Total Clicks vs. Unique Clicks: It's All About Nuance
This is one of the most fundamental distinctions in link reporting, yet it's often overlooked. Understanding the difference between total volume and unique reach can totally change how you interpret your campaign success.
- Total Clicks (Raw Traffic): Imagine this as the aggregate sum of *every single request* made to your short link, like
planck.to/offer. If one eager user clicks your link five times, this metric goes up by five. It's a fantastic indicator of engagement intensity – how many times people are interacting, even if it's the same person. - Unique Clicks (Reach): Now, this metric filters out the repeat offenders (in a good way!). It counts individual users, typically identified by unique IP addresses or cookies. So, if that same user clicks your link five times, this metric only increments by one. This is your go-to for measuring your true audience size – how many different eyeballs you're actually reaching.
Both are crucial, but they tell different stories. Don't confuse them!
Geographic and Temporal Distribution: When and Where It All Happens
Location, location, location! And timing, timing, timing! Analyzing your Top Locations metric is like getting a geographical X-ray of your campaign's reach. This lets you align your ad spend, content localization, and regional outreach efforts with actual performance. If you're suddenly seeing tons of traffic from a country you aren't even targeting, that could be a red flag—maybe bot activity, or perhaps your targeting parameters need a tweak. Similarly, Temporal Data (meaning, what time of day or day of the week people are clicking) is absolutely critical for fine-tuning the release of your email blasts, social media posts, and even live events. Timing is everything, and this data helps you nail it.
Referrer and Device Attribution: Who Sent Them, and What Are They Using?
Ever wondered where your traffic *really* comes from? Understanding the source of your clicks is paramount for accurately calculating your Return on Investment (ROI). Referrer data tells you whether that click came from a Facebook ad, a direct link in your email newsletter, or maybe an external partner's website. Combine this with Device/OS data, and you've got a powerful combo that informs your technical optimizations. For example, if you notice that 80% of clicks on your planck.to/app-download link are coming from iOS devices, then your landing page absolutely *must* be perfectly optimized for Apple users. Easy peasy!
2. Setting Your Sights: Benchmarks and Targets for Success
Here's the truth: data, by itself, is just noise. To truly understand if a link is performing well, you need context. That means comparing its numbers against established industry standards and, even more importantly, against your own historical internal data. Remember, benchmarks aren't one-size-fits-all; they can vary wildly depending on the specific channel you're using and the intent behind your link.
Click-Through Rate (CTR) Variances: What's "Good" Anyway?
When you're looking at link performance as part of a larger campaign—like an email blast or a display ad—your Click-Through Rate (CTR) is your most crucial efficiency metric. It tells you how effective your call to action (CTA) and content are at getting people to click. So, what are some standard benchmarks?
- Email Marketing: For email, you're typically looking for an average CTR somewhere between 2.5% and 5%. If one of your links consistently pulls in less than 2%, it's time for an audit! Check your Call-to-Action (CTA) placement, your subject line, or the copy itself. Maybe it's just not compelling enough.
- Social Media: Organic social media, by its very nature, tends to have a much lower CTR. We're talking generally between 0.5% and 1.5%. Why the lower numbers? It largely depends on the platform's ever-changing algorithms and the sheer volume of content users are scrolling through. Don't be discouraged by these lower percentages; they're normal for the channel.
- SMS Marketing: This channel is a superstar when it comes to engagement! SMS boasts some of the highest click rates, often soaring past 10% to even 15%. This is because SMS is personal, immediate, and typically has a very high open rate. If you've got important links to share, SMS is often your secret weapon.
Please, for the love of accurate data, do not compare metrics across different channels! A planck.to link shared via SMS is naturally going to blow the same link shared organically on Twitter out of the water. Always segment your reporting by channel to ensure you're making accurate, "apples-to-apples" comparisons.
The Click-to-Conversion Ratio: The Ultimate Measure of Success
While your link management platform can track every single click with precision, the ultimate benchmark isn't just the click itself, but what happens *after* the click: the conversion. This is where the rubber meets the road. If your campaign generates 10,000 clicks, but only 10 people actually convert (make a purchase, sign up, download something), then you've got a serious issue that probably lies post-click. We're talking about the landing page experience, the offer, or maybe even broken forms. A healthy correlation between clicks and conversions suggests that the promise your link made (via its anchor text or surrounding content) perfectly matches what your destination page actually delivers. That's the sweet spot you're aiming for!
3. Getting Down to Business: Advanced Tracking Methodologies
Alright, we've talked about what to measure and what "good" looks like. Now, let's get into the nitty-gritty of *how* to track this data effectively. To generate those high-fidelity, truly insightful reports, you absolutely must implement rigorous tracking protocols right from the moment you create your links. Remember, if your input data is messy and unstructured, getting useful analytical reports out of it is simply impossible. Garbage in, garbage out, right?
Embrace UTM Parameters: Your Best Friend for Granular Tracking
If there's one thing you take away from this section, let it be this: UTM parameters are your industry standard for granular tracking. Seriously, never—and I mean *never*—shorten a raw URL for a marketing campaign without appending your UTMs first! These tiny tags are magical because they allow your link management platform to pass super detailed data directly to your main analytics software (like Google Analytics 4, for instance). This means you won't just know someone clicked; you'll know *where* they came from, *how* they got there, and *which campaign* inspired their click.
Let me give you a clear example. Instead of just shortening yourbrand.com/sale, you should first add those crucial UTMs. It'll look a bit longer, but it's worth it:
yourbrand.com/sale?utm_source=newsletter&utm_medium=email&utm_campaign=summer_promo
Then, and only then, you shorten that entire UTM-laden URL. The beautiful result? A clean, user-friendly link like planck.to/summer-sale. But behind that elegant short link, you've preserved all the rich analytical payload needed for deep-dive backend reporting. It's truly the best of both worlds!
Centralized Dashboard Analysis: See the Big Picture
Trying to track hundreds or even thousands of individual links can feel like herding cats. That's why effective tracking absolutely demands a centralized view. Using a robust platform like Planck.to is a game-changer because it allows you to aggregate data across all your links. Instead of manually checking stats for each individual URL, advanced users leverage features like tagging and folder organization to group links by campaign (e.g., "Q4 Product Launch" or "Influencer Outreach").
This aggregation is incredibly powerful. It empowers you to report on the performance of an entire *strategy*, not just a single URL. You can quickly assess whether your "Influencer" tag is driving more overall traffic volume than your "Paid Search" tag across all the links you've generated. This bird's-eye view is crucial for strategic decision-making.
When you master the combination of well-structured UTM parameters and a centralized link management dashboard (like the one offered by Planck.to), you're not just tracking clicks—you're creating a powerful "closed loop" of data. This allows you to trace the entire user journey, from that initial click on planck.to/demo all the way through to a valuable conversion or revenue generation. That's true attribution!
4. The Rhythm of Reporting: Cadence and Structure
You know that old saying, "data has a shelf life"? Well, it's particularly true in digital marketing. The frequency of your reporting should directly correlate with how fast-moving your campaigns are. A well-defined, structured reporting cadence isn't just about ticking boxes; it's about ensuring you have the agility for quick tactical adjustments and the depth for solid strategic planning. Let's look at a typical structure.
The Daily Pulse (Operational): Catching Issues Early
Daily reporting should be lightweight, quick, and laser-focused on one main thing: anomaly detection. Your goal here is to quickly verify that all your links are active, working as they should, and that traffic flow is generally within expected parameters. Think of it as a quick health check for your links.
- Metric Focus: Primarily Total Clicks and Error Rates (like those pesky 404s).
- Action: If you've just sent out an email blast and your
planck.to/webinarlink is showing zero traffic, don't wait! Investigate immediately. It could be a broken redirect, an issue with the platform, or even an email client blocking the link. Swift action here can save your campaign from disaster.
The Weekly Review (Tactical): Optimizing on the Fly
Weekly reports are where you get a bit more granular and focus on campaign optimization. This is the perfect time to dig into your A/B testing results and make tactical adjustments. It’s about learning from the week that was and applying those lessons immediately.
- Metric Focus: CTR, Time-of-Day trends, and Device breakdown. You're looking for patterns and opportunities.
- Action: Are you seeing higher engagement during certain hours? Adjust your posting schedules! Is one channel wildly outperforming others in terms of unique click velocity? Consider reallocating some budget to lean into what's working best.
The Monthly/Quarterly Deep Dive (Strategic): The Big Picture for Stakeholders
These are your big-ticket reports, designed for stakeholders, executives, and anyone who needs to understand the long-term impact. They shouldn't just be a dump of numbers; they should tell a compelling story of growth, highlight your ROI, and identify significant long-term trends. This is where you connect the dots between tactical efforts and strategic business objectives.
- Metric Focus: Unique Reach, Geographic expansion, and Conversion attribution. You're painting a broader picture.
- Action: This is where you might say, "Hey, we saw a fantastic 40% increase in clicks from Brazil via our
planck.toassets; that's a clear signal we should be localizing our landing pages and investing more heavily in that market!" This helps determine the viability of new markets or strategies.
5. Avoiding the Traps: Common Misreads and Analytical Pitfalls
Even with the most accurate data at your fingertips, interpretation errors can quickly derail your strategies. As an analyst, you've got to be a detective, constantly vigilant against common distortions and misunderstandings in your URL data. Don't fall victim to these all-too-common traps!
The Bot Traffic Inflation: Not All Clicks Are Created Equal
Ever notice a sudden, inexplicable spike in traffic, especially almost immediately after you publish a link? It's often not human engagement; it's more likely bot activity. Many security bots diligently scan links in emails and social media posts, checking for malware or phishing attempts. While their intentions are good, reporting these as genuine human engagement will inflate your metrics and, perhaps more damagingly, artificially depress your true conversion rate. How do you spot them? Look for patterns like 0-second dwell times on your landing page, incredibly high bounce rates, or clicks originating from unusual, clustered IP addresses. Filtering out this bot traffic gives you a much clearer picture of your *real* audience engagement.
Dark Social Attribution: The Unseen Influencers
Here's a fascinating challenge: a significant chunk of link sharing actually happens in private channels. Think about all those times you've shared a link in a Slack message, a WhatsApp chat, or a private text. Analytics tools often misclassify this as "Direct" traffic because, well, there's no referrer data passed along. This phenomenon is what we call dark social. So, if you're seeing an unexpectedly high volume of "Direct" traffic to a specific short link, say planck.to/promo-viral, it's highly probable that it's being enthusiastically shared via dark social. Acknowledging this helps you properly value and account for community-led growth and organic virality that standard attribution models might otherwise completely miss. It's an invisible powerhouse!
The "Vanity Metric" Trap: Don't Just Chase the Numbers
Oh, the classic vanity metric! High click counts on a link can feel amazing, right? But here's the cold splash of reality: those high clicks are absolutely meaningless if the destination URL is broken, the content is irrelevant, or the user experience is terrible. You simply *must* cross-reference your link analytics with your on-site behavior metrics. A link that boasts 10,000 clicks but shows a 99% bounce rate isn't a success story; it's a flashing red light screaming about a fundamental mismatch between user expectation and reality. This often stems from misleading anchor text or, even worse, outright clickbait tactics, which, in the long run, do severe damage to your brand reputation and erode user trust. Always prioritize genuine engagement and value over inflated numbers.
Conclusion: Mastering Data-Driven Decisions for Digital Agility
Link performance reporting isn't just another task on your marketing checklist. It's a sophisticated discipline that demands both granular attention to detail and a broad, strategic view of your entire digital ecosystem. By moving beyond simple click counting and truly diving into the "who, where, and why" behind your traffic, you transform your URLs from passive pointers into incredibly active and powerful business intelligence tools. How cool is that?
The real goal here isn't to churn out reports just for the sake of documentation. No! It's about uncovering tangible, actionable insights that you can use *today*. Whether it's optimizing a campaign specifically for mobile users based on your OS data, or intelligently reallocating your marketing budget to high-performing geographic regions, the rich, detailed data provided by platforms like Planck.to is the absolute foundation of modern digital agility. It allows you to adapt, iterate, and conquer!
Ready to seriously level up your reporting game? Start by giving your current link usage a thorough audit. Ask yourself: Are you consistently using UTMs on *every* marketing link? Are you clearly distinguishing between unique and total clicks in your analysis? Once you've established these foundational baselines, you'll be perfectly positioned to benchmark your performance, uncover those crucial insights, and ultimately drive genuine, sustainable growth through rigorous, smart analysis. The power is in your links – go forth and analyze!
Ready to get started?
Join thousands of users who are already using our platform to manage their links efficiently.
Create Your Free Account