Why Device Data Powers Your Smarter Ad Spend
Ready to get started?
Join thousands of users who are already using our platform to manage their links efficiently.
Create Your Free AccountThe Black Hole of Wasted Ad Spend: Are You Funding the Wrong Devices?
Ever stare at your advertising dashboard, a knot forming in your stomach? You're pouring cash into campaigns, clicks are through the roof, and your click-through rate looks absolutely stellar. But then you peek at your actual conversions—the sales, the sign-ups, the tangible wins—and the numbers just... don't quite add up. Sound familiar?
If you're nodding along right now, trust me, you are definitely not alone. It's a daily battle for brilliant marketers and savvy business owners who find themselves losing thousands, sometimes tens of thousands, to the infamous "spray and pray" method of digital advertising. Here's the thing: ad platforms like Meta, Google, and LinkedIn? They *love* it when you use their automated placements. They *want* your budget spread wide, touching every screen, app, and device out there. It makes them money.
But let's get real for a second. Here's the hard truth nobody likes to talk about: not all clicks are created equal. Think about it. A casual tap from someone scrolling on their smartphone while waiting for the bus is fundamentally different, in terms of intent, from a focused click by a user sitting comfortably at their dual-monitor desktop setup in a home office. Worlds apart, right?
"Treating all devices equally in your advertising budget isn't just inefficient; it's the fastest way to set your marketing capital on fire with absolutely nothing to show for it."
If you aren't tracking *exactly* which devices are actually driving your most profitable actions, you're not just guessing—you're probably subsidizing a whole lot of wasted clicks. And that, my friends, is precisely where Device Analytics swoops in to save the day. It transforms your budget allocation strategy from a risky game of guesswork into a precise, data-driven science. It's time to stop the bleeding and start truly optimizing!
What Exactly is Device Analytics? (And Why Your Budget is Begging For It)
Alright, let's break it down. At its very core, Device Analytics is a brilliant tracking feature that dissects *how* your users are accessing your content based on their hardware type. Specifically, we're talking about categorizing your precious traffic into three main buckets: desktop, mobile, and tablet users.
Imagine this: every time you share a link, it's like building a digital bridge between your audience and your brand. Now, Device Analytics? It's the super-smart tollbooth operator standing at the entrance, diligently taking notes on the "vehicle" your customer is driving when they cross that bridge. Instead of just seeing a simple "1,000 clicks" on your latest link, you're suddenly privy to a rich, actionable breakdown: perhaps 600 clicks came from mobile, 350 from desktop, and a distinct 50 from tablets. Now, doesn't that paint a much clearer picture?
Remember, ad platforms are built to optimize for the cheapest clicks they can find, not necessarily for the device that brings you the most profitable conversions. That's why you need independent, link-level tracking. It's your personal detective, verifying exactly where your budget is truly performing its best and, more importantly, where it's being squandered on low-intent taps.
The Psychology Behind the Screen
To truly grasp why this isn't just a nice-to-have but a must-have for your budget, we need to delve a little into user psychology. It's fascinating how the device a person is using profoundly dictates their current environment and, crucially, their mindset:
- Mobile Users: Ah, the mobile warriors! They're usually in "discovery" mode, aren't they? Think rapid content consumption, often on the go, craving seamless, low-friction interactions. They're fantastic for quick, impulse purchases, but they'll often abandon complex forms faster than you can say "conversion rate."
- Desktop Users: These folks are typically in "research" or "work" mode. They've got a full keyboard, a glorious large screen, and, crucially, the patience. They're ready to dive into long-form copy, meticulously compare pricing, or fill out those detailed lead generation forms that make your sales team swoon.
- Tablet Users: Often found in "leisure" mode. They're relaxing on the couch, maybe catching up on a show. This makes them incredibly receptive to visually rich content, streaming services, and, yes, a leisurely browse through an e-commerce store looking for lifestyle products.
By understanding these distinct differences, you can finally stop throwing your hard-earned money into one giant, generic bucket. Instead, you can start strategically allocating your ad spend precisely where it will generate the highest Return on Investment (ROI). It's not rocket science, but it feels like magic when you see the results.
The "Device-First" Budget Allocation Framework: Your New Blueprint
Okay, we've talked about the "why" – why device-level insights are non-negotiable. Now, let's roll up our sleeves and dive straight into the "how." The Device-First Budget Allocation Framework isn't just a fancy name; it's a powerful, strategic approach specifically designed to help you plug those leaky holes in your ad spend and, more importantly, redistribute your funds to the devices that are *actually* driving revenue for your business. Let's get started!
Phase 1: The Diagnostic Check – Uncovering the Truth
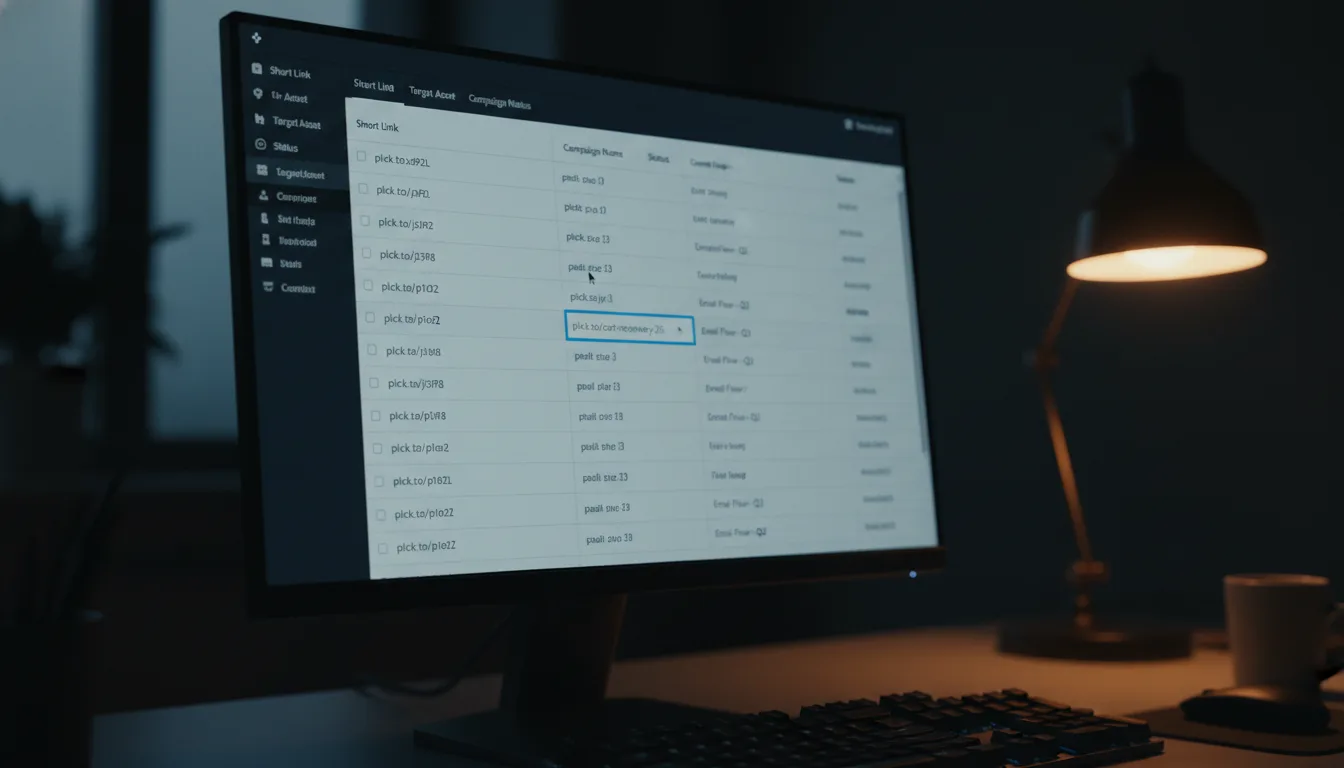
Here's a fundamental truth: you simply cannot optimize what you don't measure. So, the very first step in this framework is to isolate your traffic sources like a pro, using smart, trackable links. Instead of blindly sending traffic directly to your raw, unadorned URL, you'll route your ad traffic through a carefully tracked short link. This is your secret weapon.
For instance, if you're rocking a Facebook ad campaign, you wouldn't just paste your main website URL. Nope! You'd use a special link, something like planck.to/fb-campaign-a. By routing your traffic through this unique short link, you create an independent, unbiased source of truth. This data isn't influenced by Facebook's own algorithms, which, let's be honest, often have their own agenda.
When you're running this diagnostic phase, try to let it run for at least 7 to 14 days without tweaking your budget. Why? You need enough solid data volume to confidently identify clear statistical trends and patterns in user behavior across mobile and desktop devices. Patience here pays dividends!
Phase 2: The Intent Mapping – Connecting Clicks to Cash
Once you've diligently gathered enough data, this is where the real magic begins to happen. It's time to map those device-specific clicks to your actual business outcomes. Head over to your tracking dashboard and get ready to compare the device breakdown directly against your sales or lead data. This is where you'll find the answers you've been searching for.
Ask yourself these vital, revenue-driving questions:
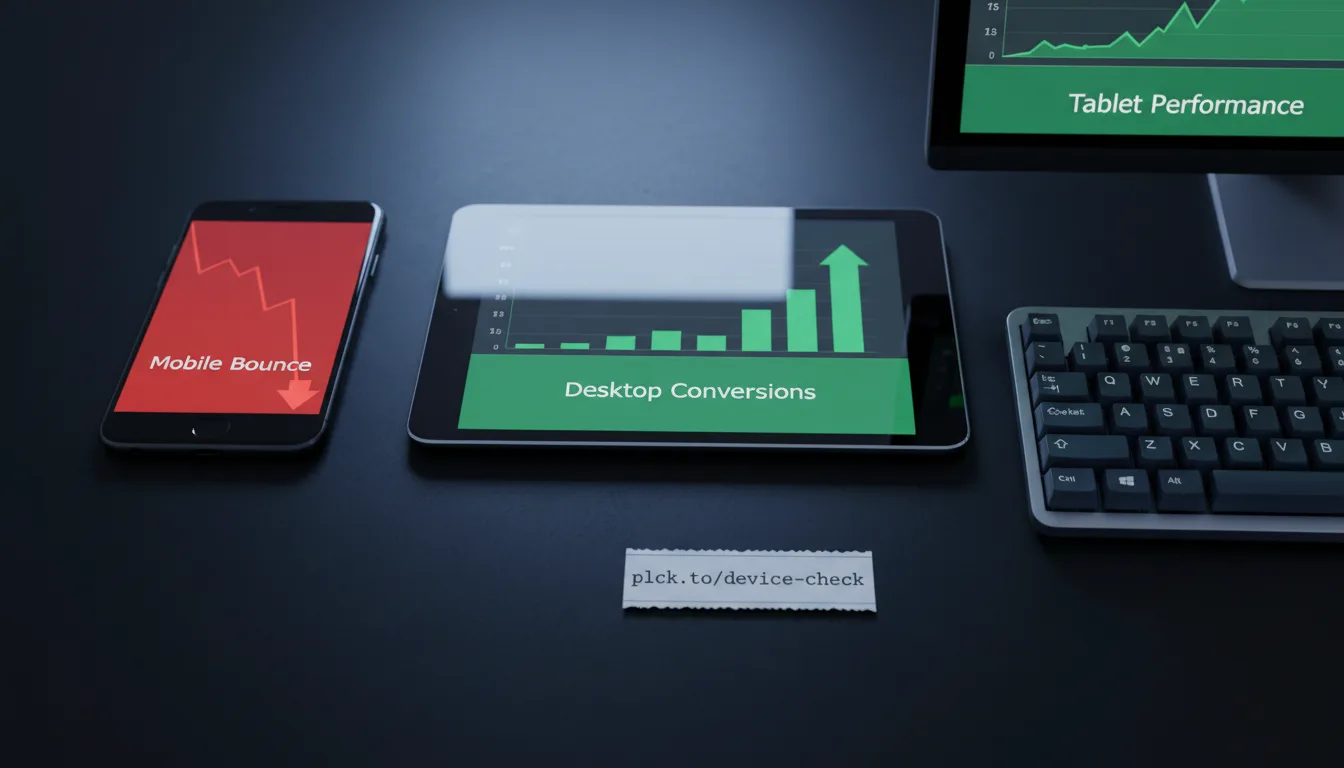
- Is it possible that 80% of my ad clicks are coming from mobile devices, but a whopping 90% of my *completed* checkouts are happening on desktop?
- Am I seeing my tablet traffic bouncing at a significantly higher rate than my mobile traffic? If so, why?
- Am I currently spending an equal budget across all devices, even though one particular device converts at twice the rate of the others?
Phase 3: The Budget Shift – Taking Aggressive Action
You've diagnosed, you've mapped, and now, my friend, it's time for action. Once you've clearly mapped out user intent across devices, it's time to make aggressive, impactful changes to your budget. Dive into your various ad platforms—Google Ads, Meta Ads, TikTok, you name it—and apply precise device-level bid adjustments.
For example, if your device analytics unequivocally reveal that desktop users are three times more likely to sign up for your high-ticket B2B software, what do you do? You decrease your mobile ad spend by a substantial 50-70% and strategically reallocate those dollars directly into your desktop campaigns. By doing this, you're not just moving money around; you're effectively buying significantly higher-quality traffic for the *exact same total budget*. Imagine the impact on your ROI!
Real-World Benefits of Device-Level Budgeting: Your Bottom Line Will Thank You
Let's be clear: implementing a device-first budget allocation strategy isn't just about making your analytics dashboard look a little prettier (though it certainly helps!). This approach has truly profound, tangible effects on your bottom line and your overall marketing performance. We're talking about real, measurable impact.
Slashing Your Cost Per Acquisition (CPA)
One of the most immediate and exciting benefits you'll witness is a drastic reduction in your Cost Per Acquisition (CPA). Think about it: when you stop throwing money at low-intent mobile clicks that simply never convert, your overall campaign efficiency doesn't just improve—it absolutely skyrockets! You're essentially trimming all the unnecessary fat from your ad spend, leaving behind only lean, high-performing muscle.
It's not uncommon for marketers who bravely shift their budget away from poor-performing devices to see their CPA drop by a staggering 20% to 40% within the first month alone. This dramatically increases overall campaign profitability, often turning previously unprofitable campaigns into goldmines!
Tailoring the User Experience (UX)
Knowing which device dominates your successful conversions allows you to do something incredibly powerful: you can meticulously optimize the entire landing page experience. If your analytics scream that your budget is best spent on mobile users, then you can ensure your landing pages aren't just mobile-friendly, but lightning-fast, featuring large, thumb-friendly buttons, and offering seamless mobile-optimized payment options like Apple Pay or Google Pay. It's about meeting your users exactly where they are, on the device they prefer, with an experience they'll love.
Scaling Winners Confidently, Not Nervously
Isn't it terrifying to scale an ad budget when you're not entirely sure *why* a campaign is working? It feels like walking a tightrope! But Device Analytics hands you the confidence you need to scale. When you know, with absolute precision, that your desktop ads are consistently yielding a 300% Return on Ad Spend (ROAS), you can confidently pump more money into those desktop-only campaigns. No more fear of wasting precious budget on mobile bounces; just smart, informed growth.
Real-World Benefits: How Businesses Are Using Device Data to Win
To truly grasp the transformative power of this strategy, let's look at a couple of practical, real-world examples. These stories highlight how different businesses harnessed device data to not just save their budgets, but dramatically boost their results.
Example 1: The B2B Software Launch That Tripled Leads
Picture this: a B2B SaaS company was pouring $10,000 a month into LinkedIn and Google Ads, eager to promote their shiny new enterprise project management tool. They were smart, though; they used a distinct trackable link, let's say planck.to/b2b-launch, across all their ad creatives.
After a couple of weeks, they dove into their device analytics. What they discovered was eye-opening: a massive 75% of their ad clicks were coming from mobile devices. However, here's the kicker—their software required users to book a demo and fill out a fairly complex 10-field form. Almost zero mobile users were completing this critical step. The remaining 25% of traffic, however, which came from desktop users, was converting absolutely brilliantly!
The Budget Allocation Shift: They acted fast. They immediately adjusted their ad platform settings, slashing mobile bids by a drastic 90% and channeling their entire budget toward desktop users. The stunning result? Their lead volume tripled, all without spending a single dollar more. That's the power of precision!
Example 2: The E-commerce Flash Sale Saved by a Pop-Up
Next up, an independent coffee roaster decided to run a super exciting weekend flash sale via Instagram Ads, pointing users to a special link: planck.to/weekend-coffee. They were thrilled to see a massive amount of traffic flooding in, but by Saturday morning, sales were surprisingly sluggish. Something felt off.
A quick check of their device analytics revealed something fascinating and frustrating: tablet traffic was extremely high, yet conversions were embarrassingly low. The culprit? Their website's pop-up banner, designed to capture email sign-ups, was completely broken on tablet screens, inadvertently preventing users from adding items to their cart. A small bug, a huge problem!
The Budget Allocation Shift: They sprang into action. They quickly turned off tablet targeting in their ad manager, stopping the budget bleed on a fundamentally broken experience. Those redirected funds were then channeled entirely to mobile smartphones, where Apple Pay was making instant, one-click purchases a breeze. Crisis averted, sales surged!
Getting Started with Smart Link Tracking: Easier Than You Think!
Taking back control of your ad budget through insightful device data might sound complex, but here's the good news: it's incredibly simple when you've got the right tools. Seriously, you don't need to be a seasoned data scientist or a coding wizard to implement this powerful framework. Anyone can do it!
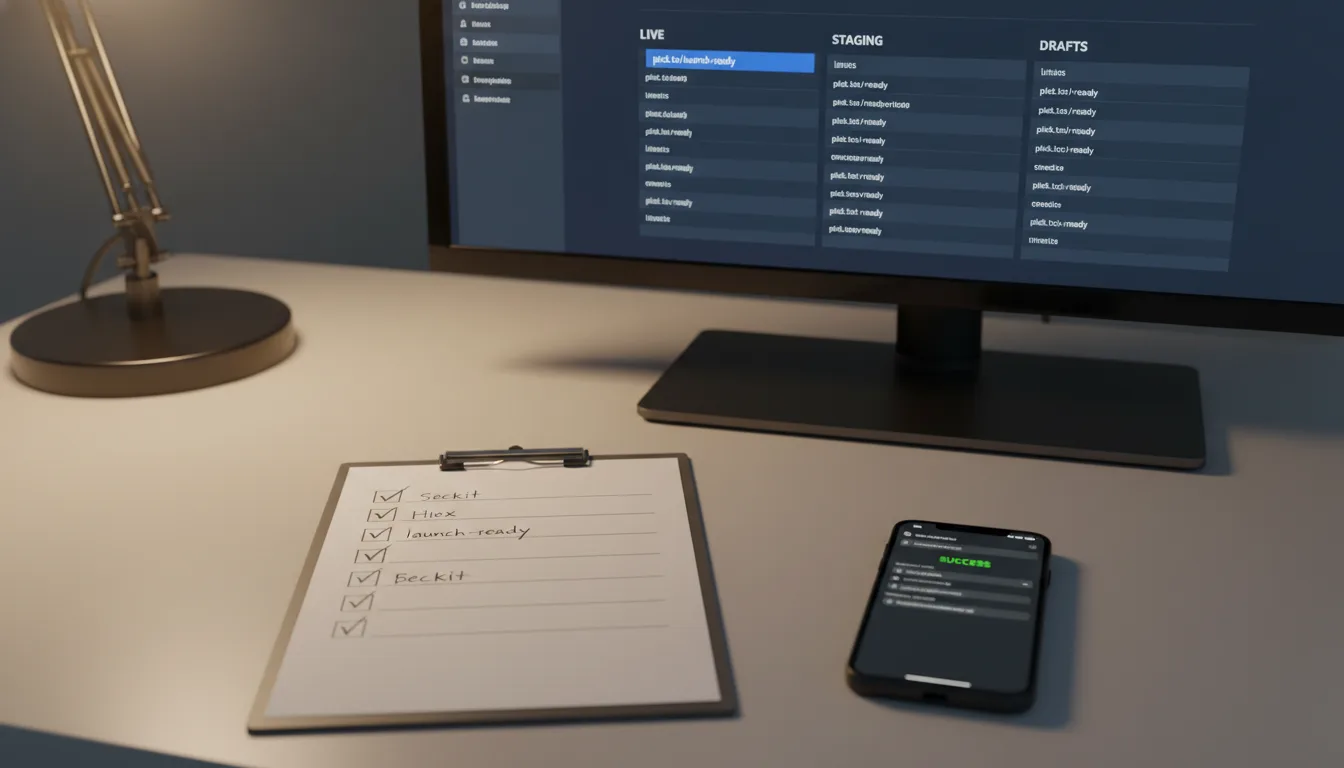
Using a smart link management platform like Planck.to, you can generate these trackable short links in mere seconds. No fuss, no headaches. Here's a straightforward, step-by-step process to get your diagnostic phase up and running today:
- Step 1: Create Your Links: Instead of mindlessly pasting your long, clunky website URL directly into your ad manager, paste it into Planck.to. In return, you'll get a clean, perfectly trackable link (for example, something like
planck.to/my-campaign). Easy peasy! - Step 2: Deploy in Ads: Now, go update your active ad campaigns, spruce up those email newsletters, and even tweak your social media bios. Replace your old links with these brand-new, powerful tracked links.
- Step 3: Monitor the Dashboard: After just a few days of running traffic, log into your analytics dashboard. You'll be greeted by intuitive visual charts that clearly break down exactly how much traffic is streaming in from desktop, mobile, and tablet users. It's like having X-ray vision for your traffic!
- Step 4: Shift the Budget: Armed with these incredibly valuable insights, head back to your ad platforms and confidently adjust your device bid modifiers. This is where you put your data to work and make those game-changing budget shifts!
Here's a pro move: create a *different* short link for each major ad platform you're using (e.g., one for Facebook, one for Google). Why? This allows you to truly drill down and see if mobile users coming from Facebook behave differently than mobile users coming from Google search! This level of granularity is a game-changer.
Advanced Tips for Maximizing Your Device Data: Beyond the Basics
Once you've confidently mastered the fundamentals of device-level budget allocation and you're seeing those sweet improvements, you might be thinking, "What else can I do?" Well, my friend, there are always advanced techniques you can layer in to squeeze even more ROI and efficiency out of your campaigns. Let's explore some next-level strategies.
1. Segmenting by Time of Day AND Device
Here's a fascinating insight: device usage isn't a static thing; it actually shifts quite dramatically throughout the day. Think about it – mobile usage often spikes during the morning commute, lunch breaks, and evening wind-down hours. Desktop usage, on the other hand, typically peaks during standard business hours (that classic 9 AM to 5 PM window). By cleverly combining your device analytics with Dayparting (the art of scheduling your ads to run at specific times), you can craft incredibly efficient ad schedules. For example, you might only run desktop ads from 9 to 5, then switch entirely to mobile ads in the evening. Smart, right?
2. A/B Testing Landing Pages per Device
If you're fortunate enough to have a healthy budget for both desktop and mobile campaigns, don't make the mistake of sending everyone to the exact same landing page! Use your precious device data to justify building device-specific landing pages. Imagine sending your desktop clicks to a meticulously detailed, long-form sales page, perhaps packed with extensive video reviews and in-depth FAQs. Meanwhile, your mobile clicks could go to a stripped-down, ultra-fast page featuring crisp bullet points, an eye-catching image, and a prominent, sticky "Buy Now" button at the bottom of the screen. Tailored experiences lead to higher conversions!
3. Watching for Cross-Device Behavior: The User Journey
This is a crucial nuance: keep in mind that some high-ticket purchases, especially in B2B or for complex consumer goods, involve multi-device journeys. A user might initially discover your amazing brand via a quick mobile ad while scrolling on the train, but they won't actually pull out their credit card and commit to a purchase until they're safely seated at their desktop computer at home or work. If you completely cut out mobile, you might inadvertently starve your desktop conversions! The trick is to use device analytics to find that perfect, delicate balancing act, rather than acting in extremes. It's about nurturing the entire user journey.
Conclusion: Stop Guessing, Start Measuring (and Winning!)
Let's wrap this up with a powerful truth: every single dollar you spend on digital marketing should be treated as an investment, not a blind gamble. Relying purely on ad platforms to automatically distribute your budget across all devices, without your informed guidance, is a surefire way to bleed cash on low-intent clicks. You work too hard for that!
By implementing a smart, device-first budget allocation strategy, you're not just tweaking numbers; you're taking back control of your entire marketing destiny. You'll stop funding the wrong devices, dramatically slash your acquisition costs, and provide a significantly better, more relevant experience for the users who are actually ready to convert. Device analytics isn't just a fancy chart in a dashboard—it's the financial compass your marketing strategy has been desperately needing. It's time to steer your ship to profit!
So, the next time you launch a campaign, let's change the conversation. Don't just ask, "How many clicks did we get?" Instead, empower yourself to ask, "What devices did those clicks actually come from, and what critical adjustments should we make to our budget starting tomorrow?"
It's time. Start generating tracked, device-aware links for your very next campaign. Diagnose your traffic like a pro, accurately map the intent of your users, and then ruthlessly shift your budget to the screens that consistently move your business forward. Your ROI, and your peace of mind, will absolutely thank you for it.
Ready to get started?
Join thousands of users who are already using our platform to manage their links efficiently.
Create Your Free Account