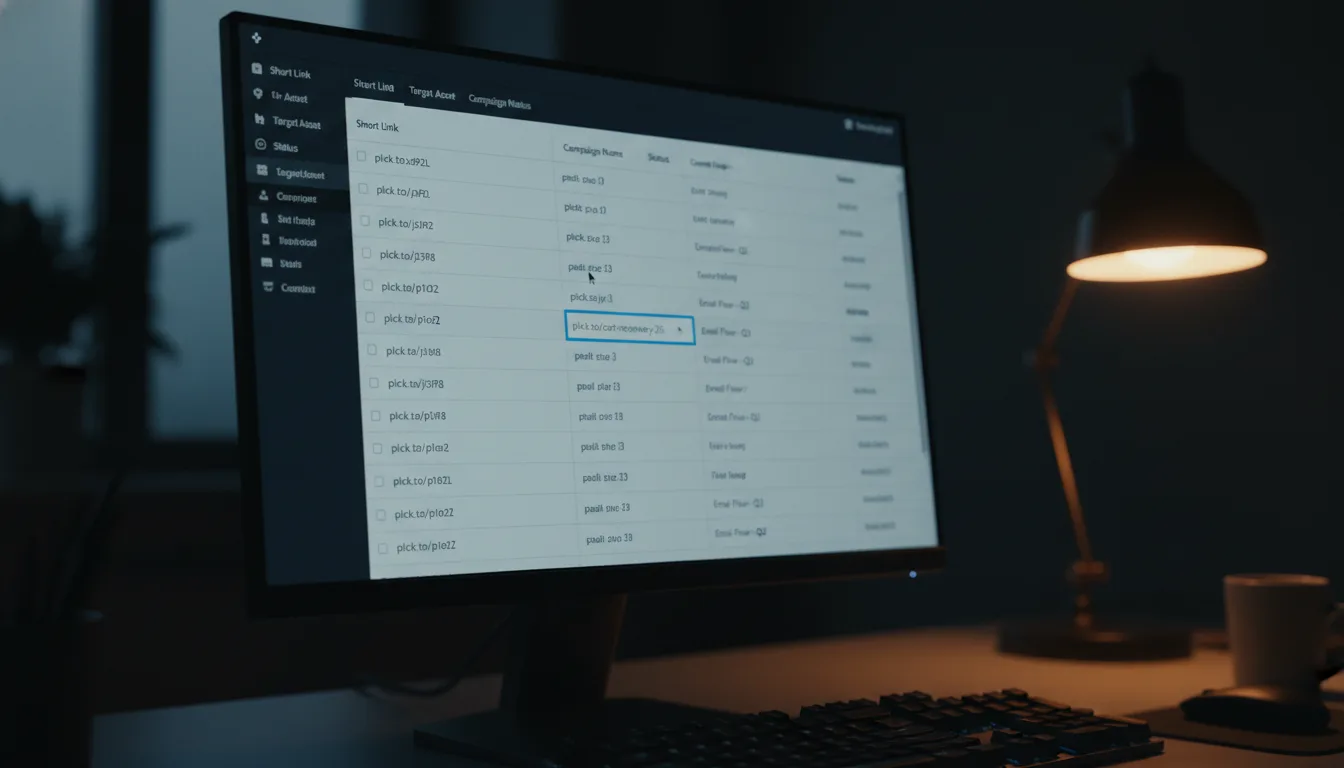
Planck Click Stats Checklist: Debugging Data Errors

Ready to get started?
Join thousands of users who are already using our platform to manage their links efficiently.
Create Your Free AccountIntroduction: Why Accurate Click Data Isn't Just Nice – It's Essential
Here's the thing about digital marketing and performance tracking: data isn't just a byproduct; it's the lifeblood of every strategic decision we make. As marketers, data analysts, or even system admins, we lean heavily on Click Statistics. We use them to gauge campaign effectiveness, understand how users interact with our content, and, crucially, calculate our return on investment. But what happens when that data goes rogue? When those numbers just don't add up?
You see, raw data isn't always perfect. Sometimes, it throws us a curveball, presenting anomalies that can totally skew our analysis. And when your analysis is off, your resource allocation becomes suboptimal – meaning you're spending time, money, and effort in the wrong places. Nobody wants that!
When you put shortened URLs out into the world to track user behavior, you're essentially setting up a tiny data factory. Every single click generates server-side logs, recording everything from total clicks and unique visitors to geographic distribution and those fascinating temporal trends. But what if these metrics start contradicting your expectations? Or worse, what if they clash with what your other analytics platforms are telling you? That's when you know it's time for a rigorous diagnostic process.
This guide isn't just another theoretical rundown. It’s a practical, analytical, and systematic roadmap to debugging those data errors in your link tracking infrastructure. Our goal? To ensure your click statistics are always accurate, always actionable, and always a true reflection of your efforts.
By adopting a structured troubleshooting methodology, you'll gain the power to isolate variables, pinpoint the exact root causes of any data discrepancies, and put robust solutions in place. This isn't just about fixing a number; it's about safeguarding the integrity of your marketing metrics, so you can make truly informed decisions.
"Think of data anomalies not as failures, but as fascinating invitations. They're asking you to peek under the hood and investigate the intricate mechanics of your tracking architecture."
Getting Started: Your Troubleshooting Toolkit & Prerequisites
Before you dive headfirst into diagnosing your click statistics, we need to set the stage. You wouldn't perform surgery without sterile instruments, right? The same goes for data diagnostics. Effective troubleshooting demands a controlled environment, a clear understanding of your typical data patterns, and a solid grasp of the technical architecture underpinning your links.
1. Establish Your Statistical Baseline (What's "Normal"?)
You can't spot a deviation if you don't know what "normal" looks like. Before you start assuming your tracking data is completely out of whack, take a moment to define your historical baseline. What's your standard Unique-to-Total Click Ratio? What's your typical daily click volume? Where do you usually see your traffic coming from geographically?
For example, let's say your baseline consistently shows a 1:1.3 ratio of unique visitors to total clicks. If you suddenly see that jump to a 1:5 ratio, that's not just a small bump; it's a statistically significant anomaly screaming for your attention. Having this baseline gives you a clear point of reference, helping you quickly identify when something truly unusual is happening.
2. Verify Your Tracking Infrastructure (Is Everything Online?)
Next up, let's make sure your core tracking mechanisms are actually doing their job. If you're using a dedicated platform for link management, like Planck.to, confirm that you have full administrative access to its analytics dashboard. Can you log in? Can you see recent data? Good. Beyond that, verify that the destination URLs your links point to have the necessary server uptime. There's nothing worse than tracking a click to a broken page! And finally, double-check that any appended tracking parameters (like UTMs) are correctly configured and systematically mapped to your central database. These little details can make a huge difference.
Here's a crucial mindset shift: data discrepancies are rarely random acts of digital chaos. More often than not, they're the logical outcomes of specific system inputs. We're talking about things like bot traffic, sneaky caching errors, or misconfigured routing protocols. Approaching the problem as a logical equation, rather than a mystery, is genuinely the fastest route to a solid resolution.
The Detective Work: Your Step-by-Step Diagnostic Checklist
Okay, so your click data looks a bit corrupted, or maybe it's just plain counterintuitive. Don't panic! It's time to put on your detective hat and work through this systematic checklist to pinpoint exactly where the failure lies. Ready? Let's go!
Step 1: Validate Link Routing and DNS Resolution
Our very first stop is the physical journey your link takes. If you're seeing a "zero-click" anomaly, it often points to a problem right at the DNS level or a URL structure that’s a bit, well, malformed. To test this, you'll want to set up a controlled experiment. Try using an isolated network or, even simpler, an incognito browser. Pop your tracking link (something like planck.to/audit-test) into the address bar and keep a close eye on the HTTP header responses.
What are you looking for? A standard 301 (Permanent) or 302 (Temporary) redirect status code. If your server is spitting back a 404 (Not Found) or a 500 (Server Error), then you've found your culprit. The clicks can't possibly be logged accurately because the request sequence is terminating prematurely. It's like trying to deliver a package to a non-existent address – it just won't get there.
Step 2: Differentiate Bot Traffic from Real Human Interaction
Ah, the ever-present problem of bots! One of the most common reasons for inflated total click metrics is non-human interaction. Think automated crawlers, social media scraping tools, and even security scanners constantly pinging URLs to index content or verify safety. They're doing their job, but they're not your target audience.
So, how do you debug this? You need to dig into the velocity and temporal distribution of your clicks. Here's what to look for:
- Check those timestamps: If you see a cluster of hundreds of clicks, all originating within a millisecond timeframe, that's a dead giveaway. Human users just can't click that fast. It's a clear sign of automated crawling.
- Analyze referrer data: High volumes of clicks that have empty or hidden referrers often point to direct server queries rather than browser-based clicks from actual people. Bots don't always bother with referrers.
- Review geographic concentrations: A sudden, massive spike of traffic from an IP block associated with a data center (rather than typical residential ISPs) is another strong indicator of bot interference.
Step 3: Analyze Unique Visitors vs. Total Clicks Variance
Understanding the fundamental mathematical relationship between total clicks and Unique Visitors is absolutely critical. Generally, unique visitors are tracked using IP hashing or browser cookies. If your total clicks are *exponentially* higher than your unique visitors, it's time to analyze user behavior. Are people refreshing the page over and over? Is there an internal system that's constantly pinging the link?
Conversely, if your unique visitors seem to *exceed* total clicks – which is a logical impossibility, by the way – then you need to investigate. Is your reporting dashboard caching old data? Or perhaps your time-series query is misaligned? These small details can drastically alter your perception of reality.
When you're meticulously auditing your unique visitor metrics, don't forget to double-check the time zone settings of your analytics platform! Imagine a data query that spans across midnight in UTC, but you're viewing it in EST. This seemingly minor detail can artificially split or aggregate unique daily visitor counts, making accurate comparison impossible. It's a surprisingly common pitfall!
Real-World Scenarios: Practical Debugging Examples
Applying all this theoretical troubleshooting to actual, practical scenarios really helps to crystallize the diagnostic process. Let's walk through two common analytical anomalies you might encounter and the methodology we'd use to resolve them. These aren't just hypotheticals; they're situations many of us have faced.
Example A: The Immediate Traffic Spike (Too Good to Be True)
The Anomaly: You've just created a brand-new tracking link, say planck.to/q3-promo, and shared it in a targeted email campaign to 500 eager subscribers. Within a mere ten minutes of hitting "send," your click statistics dashboard lights up, registering an astounding 2,500 total clicks! Wow, right? Except... zero conversions are recorded on your destination site. That's a red flag waving vigorously.
The Diagnosis: Let's do some quick math. A 500% engagement metric right out of the gate is, frankly, highly improbable for human interaction. By digging into the click logs, a savvy analyst would quickly notice that these clicks originated almost simultaneously from IP addresses that are clearly associated with corporate enterprise servers. What's the root cause here? It's likely enterprise email security software (think Proofpoint or Mimecast) "detonating" and scanning those URLs *before* the emails even land in recipients' inboxes. The data isn't lost; it's just been heavily polluted by these overzealous security bots. Once you filter those out, you'll see a much more realistic picture.
Example B: The Disconnected Demographics (London, but from Virginia?)
The Anomaly: You've launched a super-focused ad campaign, specifically targeting users exclusively in London. You're excited to see your results, but when you check your click data, it shows a whopping 60% geographic distribution originating from... Ashburn, Virginia. Wait, what?
The Diagnosis: This one's about how geographic tracking works, which primarily relies on IP address resolution. The strong concentration of traffic from Ashburn – a massive global data center hub, by the way – is a huge clue. It strongly suggests that either proxy servers or VPNs are masking the true location of your users. Or, perhaps a social media platform's link-preview generator (which often operates out of data centers) is pre-fetching the link. The solution? The analyst can successfully filter out these known data center IPs from their reports, thereby restoring the much-needed accuracy of the regional demographic data. Suddenly, London is back in London!
The beauty of this systematic approach is that by consistently identifying and filtering out known bot and data-center IP ranges from your aggregate reports, you can truly restore the statistical significance of your human-interaction data. This, in turn, ensures that your all-important conversion rate calculations are mathematically sound and genuinely reflective of real user behavior. It's about getting back to the truth!
Don't Get Tripped Up: Common Mistakes Skewing Your Click Statistics
Even the most robust tracking platforms can deliver misleading data if the initial user inputs are flawed. Identifying these "operator errors" is a crucial, often overlooked, phase of the debugging process. Sometimes, the problem isn't the system; it's how we're using it. Let's dive into some common slip-ups.
1. The Dreaded UTM Parameter Contamination
UTM tracking parameters are absolutely essential for granular analytics – they tell us *where* clicks are coming from and *how* they got there. But, oh boy, are they frequently misapplied! A classic blunder occurs when operators append UTM strings incorrectly. Imagine this: using multiple question marks in a URL query string (e.g., planck.to/campaign?utm_source=fb?utm_medium=social). See that second question mark?
This kind of malformed syntax completely breaks the HTTP request hierarchy. Your tracking server might register the initial click just fine, but the destination analytics platform? It'll fail to parse those parameters correctly, creating a frustrating data void between the click's origin and the user's behavior on the destination page. You'll see the click, but lose all the rich context.
2. Internal Traffic Pollution (We're All Guilty)
This is a big one, especially for smaller-scale campaigns. When you're trying to evaluate the statistical significance of your external campaign efforts, internal traffic can drastically skew your results. Think about it: if your marketing team of ten individuals repeatedly tests a link to verify its functionality or just checks it out of curiosity, those interactions will be logged as legitimate Total Clicks. But are they real campaign clicks? Nope!
To keep your data squeaky clean and maintain integrity, analysts *must* implement IP blacklisting for corporate networks within their analytics dashboard. This simple step prevents all that internal validation and testing from contaminating your external performance metrics, giving you a truer picture of your audience's engagement.
3. Misinterpreting Data Aggregation Windows (It's All About Timing)
Data, as we know, is often queried in very specific temporal windows. A super common analytical mistake is trying to compare click data generated in real-time against destination platforms that process their data in batches (for instance, generating reports only every 4 hours). You might look at real-time clicks and see a discrepancy, but it's not actually an error.
Before you jump to conclusions and diagnose a "missing data" error, always take a moment to verify the processing latency of both your link tracking system and the endpoint analytics software. More often than not, those "discrepancies" are simply matters of timing and synchronization, rather than actual tracking failures. Patience, young Jedi!
"It's fascinating, but in over 70% of analytical audits, what appears to be 'missing' click data isn't actually lost at all. It's merely obscured by asynchronous processing times or those pesky syntax errors in URL formatting. The data is there; you just need to know where and when to look!"
When Things Get Tricky: Advanced Troubleshooting for Edge Cases
Sometimes, even your most thorough diagnostic checklists won't quite resolve those stubborn discrepancies. That's when you know it's time to level up to advanced system troubleshooting. This involves a deeper dive, meticulously examining the technical handshake between totally disparate tracking platforms and, often, those quirky browser-level behaviors that can throw a wrench in the works.
Cross-Platform Discrepancies (Your Link Tracker vs. Your Analytics Endpoint)
This is probably the most pervasive analytical complaint out there: the frustrating variance between clicks recorded by your link manager and sessions logged by tools like Google Analytics. You know the drill. Your Planck.to dashboard proudly registers 1,000 clicks, but Google Analytics only shows 800 sessions. Immediately, your alarm bells start ringing, suspecting a major failure.
However, here's a crucial insight: a 10% to 20% variance is actually a pretty normative standard in the complex world of digital architecture. Why? Because these two systems use distinct tracking methodologies. Let's break it down:
- Execution Timing: Your link tracking platform registers a click instantaneously at the server level, right when the redirect sequence begins. Google Analytics, on the other hand, relies on a client-side JavaScript execution. What if a user clicks your link but then closes their browser before the destination page's JavaScript fully loads? Your tracking server logs the click, but the session is lost to Google Analytics. It's a timing game!
- Ad Blockers and Privacy Shields: In today's privacy-conscious world, modern web browsers and ad-blocking extensions are actively intercepting tracking scripts. A user navigating through your tracking link will be counted at the redirect server, no problem. But their browser might then block the subsequent tracking scripts on the final destination page, leading to a larger variance delta between your platforms. It's not a bug; it's a feature of modern browsing.
Caching and Redirect Loops (Browser's Sneaky Tricks)
Aggressive browser caching can seriously mess with accurate click tracking. Imagine a user visits a link, and their browser, being "smart," caches that 301 permanent redirect. Now, if they try to visit that same link again later, their browser might completely bypass your tracking server! Instead, it'll route them directly to the destination based on its local memory. The result? Your destination analytics might record more sessions than your link tracker records clicks, because the browser "remembers" the path.
To debug this tricky situation, you'll need to inspect the Cache-Control headers of your tracking links. A useful tactic for active marketing campaigns is to utilize a 302 temporary redirect instead of a 301 permanent one. This often circumvents aggressive browser caching, forcing the browser to query the tracking server and correctly register the click upon every single interaction. It's a subtle but powerful change that can bring accuracy back.
Always, always analyze your tracking metrics across the *entire* conversion funnel. Remember, a link tracker is primarily measuring intent (the click). An endpoint analytics tool, on the other hand, is measuring arrival (the session). Grasping this fundamental, mechanical difference between "intent" and "arrival" is the golden key to resolving some of the most complex data discrepancies you'll ever encounter. They're not always telling the same story, and that's okay, as long as you understand why.
Conclusion: Building a Culture of Analytics Health
At the end of the day, accurate Click Statistics aren't just numbers on a dashboard; they form the absolute empirical foundation of every successful digital strategy. So, when anomalies inevitably pop up, we can't just wave them away or make assumptions. We need to tackle them head-on with a rigorous, analytical debugging process. By doing the groundwork – establishing baseline metrics, deftly differentiating automated pings from genuine human intent, and truly understanding the complex interplay between server-side logs and client-side scripts – you’ll be able to rapidly diagnose data errors like a seasoned pro.
Remember, troubleshooting isn't a one-and-done event; it's an iterative, ongoing process. Data integrity demands constant vigilance. But here’s the good news: by consistently utilizing the checklist and insights we’ve covered in this guide – validating your routing infrastructure, auditing those tricky UTM syntax, and intelligently accounting for cross-platform variances – you'll ensure that your analytics remain a source of objective truth, not just educated guesses.
So, treat every anomaly, every weird number, as a unique opportunity. An opportunity to refine your data architecture, leading to more precise tracking, tighter system integrations, and, ultimately, significantly more reliable reporting metrics that you can truly trust. Your digital success depends on it!
Ready to get started?
Join thousands of users who are already using our platform to manage their links efficiently.
Create Your Free Account