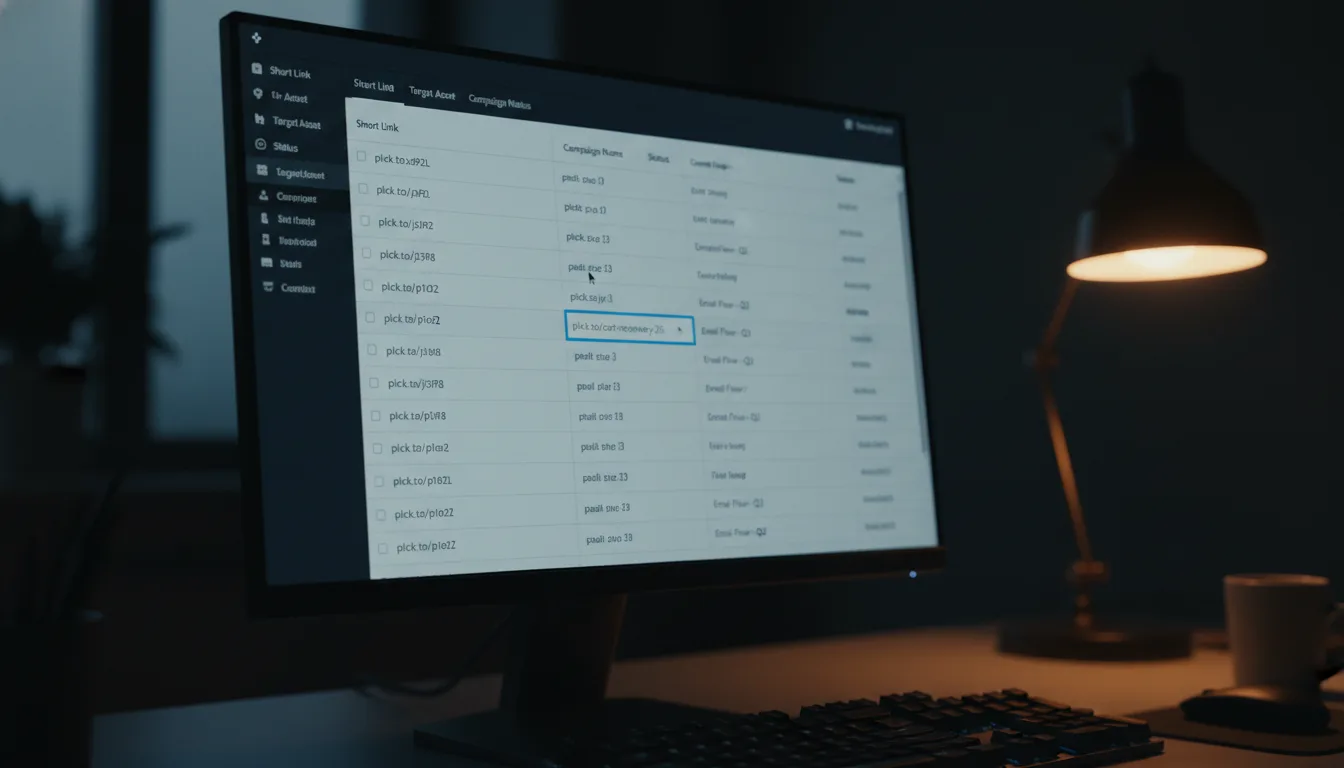
Step-by-Step: Automating Analytics with Planck's Stats API

Ready to get started?
Join thousands of users who are already using our platform to manage their links efficiently.
Create Your Free AccountUnleash Your Data: Automating Analytics with Planck's Stats API
In today's fast-paced digital world, data isn't just an afterthought; it's the very compass guiding your marketing ship. For us digital marketers, developers, and data analysts, knowing exactly how users interact with our links is absolutely fundamental. But let's be honest: are you still manually logging into dashboards, exporting dusty CSVs, and painstakingly formatting spreadsheets every single week? If so, you're not alone, and you know what? That's a surefire recipe for burnout and, inevitably, human error.
Here's the exciting part: this is where automation swoops in to completely transform your workflow! By tapping into the power of an Application Programming Interface (API), you can wave goodbye to those repetitive manual tasks. Instead, you'll pull rich, granular data directly into your own custom systems, dashboards, or reporting tools, exactly when you need it.
In this comprehensive guide, we're going to dive deep into how you can automate your link analytics using the robust Stats API provided by Planck.to. Whether you're dreaming of building a sleek, custom internal dashboard for your team or just want to trigger a quick Slack notification the moment a particular link hits a specific click threshold, you've come to the right place. We'll walk you through the entire process, step by step, making automation accessible and actionable.
Getting Started: Your Essential Prerequisites
Before we roll up our sleeves and jump into the nitty-gritty of code and API endpoints, it's crucial to make sure you've got a solid foundation. Automating analytics, while incredibly powerful, is an intermediate task that requires a few key components to get off the ground smoothly. Think of these as your toolkit before you start building something amazing!
- An Active Planck.to Account: This one's a no-brainer! You'll need an active account on the platform to unlock and utilize all those fantastic API features. Without it, you can't really play.
- Your API Credentials: This is your digital ID card, your secret key to the data kingdom. A valid API Key is absolutely essential for authenticating your requests. It tells the Planck.to server, "Hey, I'm authorized to access this data!" Keep it safe!
- An HTTP Client: To test your API requests before you even think about writing a script, you'll need a tool. Popular choices include Postman, Insomnia, or if you're comfortable with the command line, trusty old cURL. These tools let you send requests and see the raw responses.
- Basic Coding Knowledge: While you *can* manually test the API using an HTTP client, the real magic of automation comes from scripting. Knowing a bit of Python, JavaScript (Node.js), or PHP will allow you to write scripts that run on a schedule, truly automating your data retrieval.
Always, always treat your API Key like your most sensitive password. Seriously. If it accidentally gets exposed in client-side code (like public JavaScript on a website) or shared in a casual screenshot, anyone could potentially access your account's precious data. Make it a habit to store it securely, typically in environment variables on your server, never directly in your publicly accessible code.
Step 1: Decoding the API Architecture
To successfully automate your analytics, you first need to understand the fundamental structure of the Planck.to Stats API. Don't worry, it's not as complex as it sounds! At its core, APIs operate on a simple request-response model. You, the client, send a very specific request to a particular Endpoint, and the server graciously sends back the data you asked for, usually in a beautifully structured format called JSON.
The Stats Endpoint: Your Data Gateway
Our main objective here is to retrieve data about a specific shortened link. Imagine you have a link like planck.to/summer-sale that you want to track. The API needs a unique identifier for that link – it's often called the Link ID or Alias. When you put it all together, the request structure typically looks something like this:
When your script sends a GET request to this URL, you're essentially asking the Planck.to system, "Hey, show me absolutely everything that's happened with *this specific link*." It's like asking for a comprehensive report tailored to one of your key assets.
Authentication Headers: The Digital Handshake
Now, the server isn't going to just hand over your valuable analytics to anyone who asks. You need to prove who you are! This is where your API key comes into play. You must include it in the header of your request. This isn't just a formality; it's the crucial digital handshake that confirms your identity and authorization. In most modern REST APIs, this is usually handled via a Bearer Token or a specific API-Key header, acting as your credential for secure access.
When you're crafting your automation script, always strive to separate your configuration logic from your execution logic. This means storing sensitive information like your API Key in a separate configuration file. Crucially, make sure this file is explicitly excluded from version control systems (like Git) to prevent any accidental leaks to public repositories. Security first!
Step 2: Retrieving and Making Sense of Your Data
Once you've successfully authenticated your request and hit the correct endpoint, the Planck.to API will send back a beautiful JSON object. This isn't just random text; it's the rich, raw material for all your automation dreams! Learning how to parse and interpret this data is the next crucial step. It's how you'll transform a blob of text into truly meaningful, actionable insights for your campaigns.
Interpreting the JSON Response: What Are We Looking At?
The JSON response you get back will typically contain several nested objects, each representing different dimensions of your link's performance data. It's like a neatly organized digital report! Here's a quick breakdown of the valuable information you'll commonly find in the Stats API response:
- Total Clicks: This is the straightforward, raw count of every single time your link was clicked. It gives you a basic understanding of overall activity.
- Unique Clicks: Often even more valuable than total clicks, this metric shows you the number of distinct users (or rather, distinct devices/IPs) who clicked your link. It's a much better indicator of your true reach and audience engagement.
- Referrers: Curious where your traffic is coming from? This list will show you the sources – think Facebook, Twitter, direct traffic, email campaigns, and more. It’s essential for understanding your marketing channel effectiveness.
- Geographic Data: Get a detailed breakdown of clicks by country or even city! This feature is incredibly useful, allowing you to visually map out your audience's locations and tailor your content or targeting accordingly.
- Browsers/OS: This provides technical insights into the devices and operating systems your audience is using. Such data helps you optimize your landing pages and user experience for the most common platforms your visitors employ.
When you're building an automated solution, you won't always need *all* this data simultaneously. The beauty of automation is that your script can be finely tuned to extract only the most specific metrics you require for your current report or dashboard, making your process lean and efficient.
Raw data holds immense potential, but it's *processed* data that truly unlocks power. The real value of an API isn't just getting access to information; it's in how intelligently you filter, analyze, and present that information to drive smart, impactful decisions.
Step 3: Crafting Powerful Automation Workflows
Alright, we've covered the mechanics of fetching your data. Now for the really exciting part: how do we actually *use* this in a real-world marketing scenario? Let's explore three practical, impactful ways you can apply Planck.to's Stats API to elevate your marketing game.
Workflow A: The Automated Weekly Executive Summary
Picture this: your boss asks for a campaign performance report every Monday morning, without fail. Manually compiling this data week after week is, let's face it, incredibly tedious and a time drain. But what if you could have it delivered to their inbox automatically? That's exactly what an automated script can do for you. Imagine it running diligently every Monday at 8:00 AM, like clockwork:
- Fetch Active Links: First, your script sends a request to get a list of all active links that were created or saw activity over the last 7 days.
- Iterate & Gather Stats: Next, for each relevant link (e.g.,
planck.to/promo-1,planck.to/promo-2, etc.), the script hits the Stats endpoint, pulling in all the performance data. - Aggregate & Analyze: It then crunches the numbers, summing up total clicks across campaigns and identifying the top-performing referrer sources for the week.
- Format & Report: Finally, the script neatly formats this aggregated data into a clean, easy-to-read HTML email and automatically dispatches it to the executive team. No more last-minute scrambles!
By implementing this automated workflow, you're not just saving time; you're reclaiming approximately 1-2 hours of manual reporting per week! This incredible efficiency boost frees you and your team to focus on high-value strategic thinking and creative execution, rather than getting bogged down in repetitive data entry.
Workflow B: Building a Real-Time BI Dashboard
Static reports are good, sure, but live, dynamic dashboards? Those are truly next-level. If your company already leverages powerful Business Intelligence (BI) tools like Google Data Studio, Tableau, or PowerBI, you can integrate the Planck.to API to feed fresh, real-time data directly into these platforms. Imagine the possibilities!
Here's how it works: You can set up a "middleware" script that runs, say, every hour. This script's job is to fetch the absolute latest stats for your most critical operational links. Once it has the data, it appends it to a centralized data source – perhaps a Google Sheet or an SQL database – which is then connected to your BI tool. The result? Your entire team gets a constantly updated, live view of how a new product launch is performing, how a specific campaign is trending, or how a critical sales link is being engaged with, all without anyone needing to manually refresh a single webpage. It's truly data at your fingertips.
Workflow C: Automated Optimization Triggers
Now, this is where automation gets really sophisticated! Advanced automation isn't just about passively reading data; it's about proactively *acting* on it. You can program intelligent logic into your scripts that automatically trigger actions based on the performance stats returned by the API. This moves you from reporting to real-time optimization.
For instance, let's say you're A/B testing two different landing pages, each using a unique shortened link (like planck.to/variant-a and planck.to/variant-b). Your script could be scheduled to check the click-through rates (CTR) for both links every 6 hours. If Variant A starts demonstrably outperforming Variant B – say, receiving 80% more traffic – the script could automatically send an alert to your marketing team via Slack. This immediate notification prompts them to shift all advertising budget towards the winning Variant A, optimizing your ad spend and campaign performance in near real-time. That's smart marketing in action!
Avoiding Common Pitfalls: Smooth Sailing with Your Automation
Even the most seasoned developers can hit a few bumps in the road when automating API calls. It's a natural part of the process! But by being aware of the most common pitfalls, you can often sidestep them entirely. Here are the top mistakes to watch out for when you're working with analytics data via an API, along with how to gracefully navigate around them.
1. Ignoring Rate Limits
Every API has a specific limit on how many requests you can make within a certain timeframe – for example, 60 requests per minute. If your script gets overzealous and tries to fetch stats for 5,000 links all at once, in a blink of an eye, you're almost certainly going to run into a "429 Too Many Requests" error. The server's way of saying, "Slow down, partner!"
The Fix: The solution is to implement what's known as "throttling" or "sleep" functions in your code. This means introducing small pauses between your requests. Make a request, then have your script wait for a fraction of a second, and *then* make the next one. This polite approach keeps you within the API's limits and ensures your data keeps flowing without interruption.
2. Misinterpreting Timezones
Analytics data is inherently time-sensitive, and timezones can be deceptively tricky. The Planck.to API might return data in UTC (Coordinated Universal Time), which is a common standard. However, your critical marketing report might need to reflect performance in EST (Eastern Standard Time) or your local business time. If you neglect to properly convert these timestamps, your "daily" report could inaccurately cut off clicks that happened late in the evening, incorrectly attributing them to the following day.
The Fix: Always, always consult the API documentation to confirm the timezone standard used in its responses. Then, employ a reliable date/time library in your chosen programming language (like Moment.js for JavaScript or Python's datetime module) to accurately convert the data to your desired local business time. This ensures your reports are always precise and timely.
3. Hardcoding Link IDs
It's super tempting when you're first building a script to hardcode a specific link ID, like 12345, directly into your code. It works, right? But here's the rub: campaigns evolve, links get archived, and new ones are constantly created. If you launch a brand-new campaign next week and generate new links, your hardcoded script will instantly become outdated, forcing you to go back and rewrite your code every time.
The Fix: The smarter, more robust approach is to write your script to first fetch a dynamic list of "active" or relevant links. Once you have that list, you can then loop through each item, querying the Stats API for its performance data. This makes your automation incredibly flexible and future-proof, adapting seamlessly to changes in your campaigns without needing constant manual updates.
Troubleshooting: What to Do When Your Automation Stumbles
Let's be real: even with the best planning, automation sometimes throws a curveball. When your script unexpectedly fails, the API will communicate what went wrong by returning an HTTP status code. Knowing how to quickly read and interpret these codes is often the very first, and most crucial, step in efficiently troubleshooting and getting your automation back on track.
- 401 Unauthorized: This status code is almost always a dead giveaway. It means your API key is either missing from the request, it's expired, or it's been copied incorrectly. Double-check your authentication headers and ensure your key is valid and correctly placed.
- 404 Not Found: If you see a 404, it means you're asking for statistics on a link that simply doesn't exist in the system. Carefully review the Link ID or alias you're providing. Did you accidentally type
planck.to/exmapleinstead of the correctplanck.to/example? Small typos can make a big difference! - 500 Internal Server Error: This one is a bit different. A 500 error typically indicates an issue on the Planck.to platform's side, not with your code. Your best bet is to wait a few minutes and try your request again. If the problem persists, don't hesitate to reach out to their support team for assistance.
A golden rule for robust automation: always include comprehensive error handling in your scripts! This means that if a particular API request fails for any reason, your script should log the error details (so you can investigate later) and then gracefully continue processing the next item in its queue, rather than simply crashing entirely. This makes your automation much more resilient.
Ready to Automate? Dive In!
Automating your analytics with Planck.to's Stats API is more than just a technical exercise; it's a truly powerful way to reclaim your valuable time and unlock profoundly deeper insights into your marketing performance. By consciously shifting away from the laborious grind of manual data entry and wholeheartedly embracing programmatic data retrieval, you dramatically reduce the risk of human error. Even better, you empower your team with immediate, consistent access to the freshest, most accurate data, ensuring everyone is always on the same page.
Don't feel overwhelmed; just start small! Begin by writing a simple script – perhaps one that fetches the total clicks for your single top-performing link. Once you feel comfortable with that fundamental request-response cycle and see the immediate benefits, you can then confidently expand your automation. Think bigger: integrate geographic breakdowns, set up weekly reporting summaries, or even feed data directly into your fancy new BI dashboard. The initial investment in setting up these smart workflows will absolutely pay massive dividends in terms of efficiency and data accuracy for years and years to come.
Always remember, the ultimate goal of automation isn't just about working faster, though that's certainly a huge perk. It's about freeing up your precious mental bandwidth. It's about giving you and your team more time and energy to focus on the truly creative, strategic, and innovative work that genuinely drives growth and propels your business forward.
Ready to get started?
Join thousands of users who are already using our platform to manage their links efficiently.
Create Your Free Account